- Research article
- Open access
- Published:
Thyroid function, body mass index, and metabolic risk markers in euthyroid adults: a cohort study
BMC Endocrine Disorders volume 19, Article number: 58 (2019)
Abstract
Background
In recent years, the relationship between thyroid stimulating hormone (TSH) and obesity has been widely discussed. However, it is unclear how thyroid hormone concentrations relate to body weight and its impact on metabolic risk markers. This study aimed to assess how thyroid function is linked to underweight, overweight, or obesity, and metabolic risk markers in adults.
Methods
A total of 16,975 subjects, aged 18–80 years, who attended the Health Management Center of Tongji Hospital, Wuhan, China were enrolled in this study. Anthropometric and laboratory data were collected and analyzed.
Results
Serum free triiodothyronine (fT3) and fT3/free thyroxine (fT4) ratio (fT3/fT4) were positively associated with body mass index (BMI) (P < 0.001), while there was a negative relationship between fT4 and BMI (P < 0.001) according to multivariable regression analysis adjusted for age and sex. Associations between thyroid hormone concentrations and markers of blood pressure, and lipid and glucose metabolism were identified after adjustment for age, sex, and BMI, with TSH being negatively associated with fasting blood glucose (FBG). fT3 was positively associated with systolic blood pressure and low-density lipoprotein-cholesterol, while fT4 was positively associated with diastolic blood pressure, FBG, and high-density lipoprotein-cholesterol (HDL-C), and negatively associated with hemoglobin A1c (HbA1c) and triglyceride. Finally, fT3/fT4 was positively associated with HbA1c and triglyceride, and negatively associated with HDL-C.
Conclusions
Overweight or obese participants had a high serum concentration of fT3, high fT3/fT4 ratio, and a low concentration of fT4. Underweight participants had high concentrations of fT4 and low concentrations of fT3. Thus, relationships between thyroid hormones and metabolic risk markers were identified which suggest that thyroid function might be one factor that influences body weight and the co-morbidities of obesity.
Background
Thyroid hormones play an important role in regulating thermogenesis, and glucose and lipid metabolism, which make them a key factor regulating mammalian dynamic energy balance [1]. The effects of hypo- or hyperthyroidism on body weight were observed a long time ago. The low thyroid hormone concentrations that characterize hypothyroidism are associated with lower energy expenditure [2] and fluid retention [3], whereas hyperthyroidism is often associated with an increase in energy expenditure and weight loss. However, the relationship between thyroid function within the normal range and body weight has not been fully characterized.
Twenty percent of severely obese people have subclinical hypothyroidism [4], which is defined by the presence of a high concentration of thyroid stimulating hormone (TSH), but a normal concentration of thyroxin (T4) or free thyroxin (fT4) [5]. Some scholars have attempted to attribute obesity to subclinical hypothyroidism [6]. However, studies have shown that in obese patients, in addition to the high TSH concentration, there are also high concentrations of free triiodothyronine (fT3) [7, 8] and fT4 [7], which contrasts with subclinical hypothyroidism, during which serum fT4 and fT3 concentrations are at the lower end of the normal range. This is inconsistent with subclinical hypothyroidism being a cause of obesity, and therefore the relationship between thyroid function and body weight requires further study.
Several studies have evaluated the relationship between obesity and thyroid function in euthyroid adults [9,10,11,12]. Muscogiuri et al. [10] reported that obesity is positively associated with TSH concentration, while other researchers have found no association between adiposity and TSH [11, 12], triiodothyronine (T3) [11, 12], or fT4 [11]. In pediatric cohort studies, TSH concentration has been shown to be positively associated with body mass index (BMI) and fat mass [6, 13,14,15]. Jin et al. [6] reported a negative association between fT4 and BMI, but Lundback et al. [13] did not find any association between adiposity and fT3 or fT4. However, these studies were of relatively small samples, which may explain their contrasting conclusions. Therefore, larger scale investigations of the relationships between TSH secretion, fT3, and fT4 with body weight in the general population are required.
TSH concentrations within the normal range have previously been reported to be associated with metabolic risk factors in obese children [6, 13] and in adults [16]. Jin et al. [6] have shown that serum TSH is associated with lipid profile in obese children and adolescents, while Rahbar et al. [16] found no significant differences between a high-TSH and a low-TSH group with regard to serum triglyceride (TG), total cholesterol (TC), and high-density lipoprotein-cholesterol (HDL-C) concentrations in euthyroid adults. These disparities imply a lack of clarity in the literature with regard to whether TSH and thyroid hormones regulate metabolism in obese patients.
The purpose of this study was to elucidate the relationships between thyroid hormone concentrations within the normal range and body weight, including in overweight, obese, and underweight individuals, and metabolic status in the general population, using a large sample. The findings hence represent a snapshot of normal physiology and no causal relationship can be inferred.
Methods
Study participants
This was a cross-sectional study conducted between January 1st and December 31th, 2017, at the Health Management Center of Tongji Hospital, Wuhan, China. All the participants who underwent a health check during 2017 were screened for their eligibility to enroll in this study. They all underwent a routine medical examination, had anthropometric measurements made, and provided overnight fasting blood samples and information regarding their medical history, as part of the health check. We selected subjects 18–80 years, in whom thyroid hormone concentrations had been measured and were within the normal range. Participants who were being treated because of a thyroid disorder, or who were current users of drugs known to influence thyroid function, including lithium, amiodarone, estrogen, and corticosteroids, were excluded. In addition, participants with diabetes, cardiovascular disease, chronic lung disease, cancer, renal failure, autoimmune disease, inflammation, pregnancy, or other diseases that might affect thyroid hormone concentrations or metabolism were excluded. A flow diagram describing the selection strategy is shown as Fig. 1.
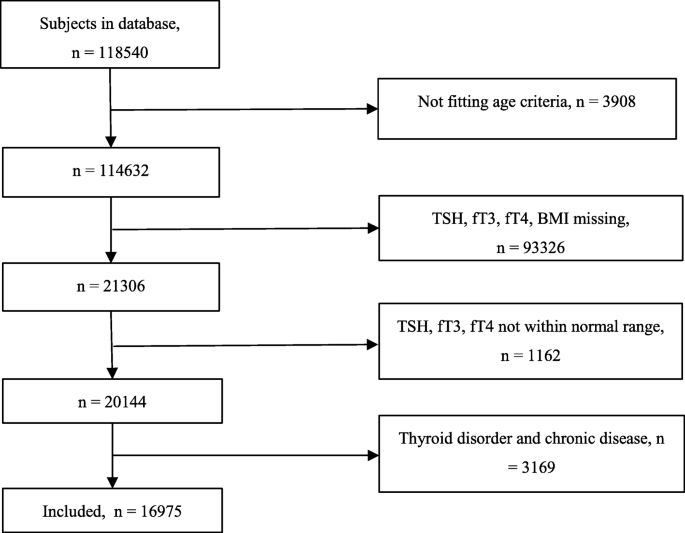
Flow diagram describing the selection strategy. The participants were 18–80 years old. Reference ranges for thyroid-stimulating hormone (TSH): 0.35–4.94 μIU/ml, free triiodothyronine (fT3): 1.71–3.71 pg/ml, free thyroxine (fT4) 0.7–1.48 ng/dl=
After participants had been excluded on the basis of the criteria listed above, a total of 16,975 subjects were enrolled, and they provided written informed consent before participating. The study protocol was approved by the Ethics Committee of Tongji Hospital, Tongji Medical College, Huazhong University of Science and Technology.
Anthropometric measurements
The height and body mass of the participants were measured using a stadiometer, in the absence of a coat and shoes. BMI was calculated as body mass (kg) divided by the square of height (m2), and participants were categorized as underweight (BMI < 18.5 kg/m2), normal weight (18.5 kg/m2 ≤ BMI < 23.9 kg/m2), overweight (24.0 kg/m2 ≤ BMI < 27.9 kg/m2), or obese (BMI ≥28 kg/m2), according to the 2003 Working Group on Obesity in China (WGOC) guidelines [17]. Blood pressure was measured in the sitting position after 10 min of rest using an electronic sphygmomanometer (HBP-9020; Omron, Dalian, China).
Biochemical measurements
Blood samples were obtained after an overnight fast, and routine biochemical analyses (TSH, fT3, fT4, TC, TG, low-density lipoprotein-cholesterol [LDL-C], and HDL-C) were performed at accredited hospital laboratories. The reference ranges were: TSH 0.35–4.94 μIU/ml, fT3 1.71–3.71 pg/ml, fT4 0.7–1.48 ng/dl, TC < 5.8 mmol/L, TG < 1.70 mmol/L, HDL-C 1.04–1.55 mmol/L, and LDL-C < 3.37 mmol/L. Dyslipidemia was classified as previously [18]: hypercholesterolemia: total cholesterol ≥5.8 mmol/L; hypertriglyceridemia: triglyceride ≥1.70 mmol/L; mixed hyperlipidemia: total cholesterol ≥5.8 mmol/L and triglyceride ≥1.70 mmol/L; low HDL-C: high-density lipoprotein ≤1.04 mmol/L.
Statistical analysis
Data were processed and analyzed using IBM SPSS software version 22.0 (IBM Inc., Armonk, NY, USA). Continuous variables are expressed as mean ± standard deviation and were compared using Student’s t test. The relationships between thyroid hormone concentrations and other parameters were evaluated using Pearson’s correlation. Multiple linear regressions were used to assess the relationships between thyroid parameters and metabolic risk markers. Odds ratios (ORs) and 95% confidence intervals (CIs) for quartiles of thyroid parameters obtained from logistic regression models were used to predict the risk of overweight, obesity, and dyslipidemia, after adjustment for age and sex. All statistical tests were two-sided and P < 0.05 was considered to indicate statistical significance.
Results
Characteristics of the participants
A total of 16,975 euthyroid individuals of the 118,540 people attending the Health Management Center of Tongji Hospital were included in this study. Their mean age was 41.7 ± 10.5 years and 9523 (56.1%) were men. The participants were classified into four groups (underweight, normal weight, overweight, or obese). The baseline characteristics of the participants in each group are presented in Table 1. Independent Student’s t-tests showed there were significant differences between the normal weight group and other weight groups in most anthropometric and laboratory indexes. Of these, systolic blood pressure (SBP), diastolic blood pressure (DBP), fT3, fT3/fT4 ratio, fasting blood glucose (FBG), hemoglobin A1c (HbA1c), TG, TC, LDL-C, and homocysteine were higher in the higher weight groups, whereas fT4 and HDL-C were higher in the lower weight groups (Table 1).
Relationships between thyroid parameters and metabolic indexes
According to Pearson correlation analysis, thyroid function indicators were not linearly correlated with most metabolic risk factors, given that these significant p values do not make the correlations clinically significant. Multivariable regression analysis, adjusted for age and sex, showed no significant correlations between TSH and BMI, but fT3 and fT3/fT4 were positively correlated with BMI, and fT4 was negatively correlated with BMI (all P < 0.001) (Table 2). Higher SBP was associated with higher fT3 concentration (P = 0.004) and DBP was positively correlated with fT4 (P < 0.001). FBG was negatively associated with TSH (P = 0.006) and positively associated with fT4 (P < 0.001). Higher HbA1c concentration was associated with lower fT4 (P = 0.017) and higher fT3/fT4 (P = 0.002). Serum TG was positively associated with TSH and fT3/fT4, and negatively associated with fT4 (all P < 0.001). No significant association was observed between TC and TSH, fT3, fT4 or fT3/fT4. Higher LDL-C concentration was only associated with a higher concentration of fT3 (P = 0.009), and higher HDL-C was only associated with higher fT4 (P = 0.005). There was no relationship between serum homocysteine and TSH, fT3, fT4, or fT3/fT4.
Risks of underweight, overweight, obesity, or dyslipidemia
According to logistic regression analyses, quartiles 2 to 4 of fT4 serum concentration were associated with a higher risk of underweight than quartile 1 (ORs for quartiles 2–4 were 2.526, 2.499, and 1.770, respectively), after adjustment for age and sex. The higher quartiles of TSH (quartiles 2–3), fT3 (quartiles 3–4) and fT4 (quartiles 2–4) concentration were associated with a higher risk of overweight. In addition, the higher quartiles of TSH (quartiles 2–4) and fT3/fT4 (quartiles 2–4) were associated with a higher risk of obesity. ORs of 1.71 and 4.14 were obtained for the highest TSH and fT3/fT4 quartiles, respectively, when they were compared with the lowest quartiles for the prediction of obesity (Table 3).
Table 4 shows the thyroid parameters, divided into quartiles, in the presence of dyslipidemia. Dyslipidemia was classified as hypercholesterolemia, hypertriglyceridemia, mixed hyperlipidemia, or low HDL-C concentration, on the basis of the Chinese Guidelines on the Prevention and Treatment of Dyslipidemia in Adults [18]. The highest TSH quartile was associated with a higher risk of hypercholesterolemia (OR, 1.39; 95% CI, 1.07–1.81), hypertriglyceridemia (OR, 1.35; 95% CI, 1.11–1.63), and mixed hyperlipidemia (OR, 1.68; 95% CI, 1.19–2.36). The highest fT3 quartile predicted hypertriglyceridemia with an OR of 1.64 (95% CI, 1.10–2.46), the lower quartiles of fT4 were associated with a higher risk of hypertriglyceridemia and low HDL-C, and the higher quartiles of fT3/fT4 were associated with a higher risk of low HDL-C.
Discussion
It is well known that thyroid hormones regulate heat production; indeed about 30% of the heat generated to maintain body temperature is dependent on thyroid hormone action [19]. The relationship between body weight and the hypothalamic-pituitary-thyroid axis (HPT axis) is intriguing; for example, some researchers have found that small changes in thyroid function can cause significant changes in weight in overweight patients, who are often thought to be obese due to thyroid dysfunction [20, 21].
Several studies have investigated the relationship between obesity and TSH in euthyroid children [6, 13], finding that BMI is positively correlated with the serum concentration of TSH and negatively correlated with the serum concentration of fT4 after adjusting for age [6], or conversely no significant associations between fT3 or fT4 and BMI [13]. In addition, other pediatric studies found no association between fT4 and BMI [21,22,23]. Because of these contradictory findings, we undertook the present study using a large sample of 16,975 patients as an adjunct to a comprehensive health examination using standard procedures. To better understanding the specific role of thyroid function in weight regulation, we compared indexes of thyroid function in underweight, normal, overweight and obese participants.
In the present study, a high concentration of fT3 and a low concentration of fT4 were associated with a high risk of overweight. Furthermore, a high concentration of TSH and fT3/fT4 were associated with a higher risk of obesity, implying that the differences in the HPT axis in obesity do not purely represent an exacerbation of the differences present in overweight. In the underweight group, serum TSH concentration was similar to that of normal weight participants, but fT3 concentration and fT3/fT4 were lower, and fT4 was higher. In addition, patients in the first quartile of fT4 had a lower risk of being underweight than the other participants.
Leptin has been reported to be a key component of the complex physiologic regulation of the HPT axis [24] and serum leptin is associated with TSH concentration [25]. In obesity, the leptin concentration increases, and it crosses the blood-brain barrier to regulate the endocrine system through actions in the arcuate nucleus of the hypothalamus [26]. Leptin signaling has also been shown to be required for the maintenance of thyrotropin-releasing hormone (TRH) expression in the hypothalamic paraventricular nucleus [27]. Several epidemiologic studies have found a positive relationship between serum TSH and leptin concentrations in humans [25]. However, conversely, TSH receptors located on adipose cell membranes regulate adipocyte proliferation [28], which may partly explain the association between high TSH concentration and a higher risk of overweight or obesity. Greater secretion of TRH and TSH from the hypothalamus and pituitary leads to the secretion of more thyroid hormone, which would have a compensatory effect to increase metabolism and energy consumption in the periphery. This increase in resting energy expenditure may represent an adaptive response to weight gain.
In addition, TSH increases deiodinase activity and therefore the preferential production of T3 in thyroid cell cultures [29, 30]. Recent studies have shown that at least within the normal range of thyroid function, TSH preferentially increases serum fT3 over fT4 [31], which may at least partly explain the higher fT3 and fT3/fT4 alongside the higher TSH in the overweight and obese groups, in the absence of a similar difference in fT4.
Analysis of the relationships between underweight, and TSH and thyroid hormone concentrations showed no difference in the hypothalamic-pituitary axis (H-P axis) from the normal weight group, while thyroid hormone concentrations showed the opposite difference to that of the overweight or obese groups. TSH and fT3 showed a dependent change in the overweight or obese group, but not in the underweight group, implying that the differences in HPT axis activation in underweight are not just the reverse of those identified in overweight or obesity. However, the mechanism of the relationship between underweight and thyroid function requires further exploration.
It is well known that thyroid hormones can affect serum cholesterol concentration [32]. Here, we investigated the relationships between TSH and thyroid hormones, and serum lipid concentrations, and found that individuals in the higher quartiles of TSH concentration have higher risks of hypercholesterolemia, hypertriglyceridemia, and mixed hyperlipidemia, independent of the effect of BMI. fT3 concentration was positively linked with LDL-C concentration, the lower quartiles of fT4 were associated with hypertriglyceridemia and low serum HDL-C, and high fT3/fT4 was associated with a higher risk of low HDL-C concentration. Thus, TSH and thyroid hormones, even within the normal range of serum concentrations, can influence lipid metabolism. This reflects the sensitivity of blood lipids to minor changes in the activity of the HPT axis, but more research should be conducted to investigate the mechanism underlying the link between blood lipid and thyroid hormones.
Thyroid function is also associated with other metabolic/cardiovascular parameters, such as blood pressure and glucose metabolism. The results showed that SBP was positively correlated with fT3, and DBP was positively correlated with fT4. Previous study by Roos et al. [33] found a correlation between fT4 level and blood pressure and suggested that serum fT3 and fT4 are risk factors for cardiovascular disease rather than serum TSH. The effect of thyroid function on blood pressure is complex and the mechanism is not well understood. It is well known that thyroid diseases can affect cardiac output, peripheral vascular resistance, renal hemodynamics, sodium homeostasis, vascular endothelial function, renin-angiotensin-aldosterone system and many other aspects. This study also found that FBG was negatively correlated with TSH and positively correlated with fT4, and high HbA1c was associated with low serum fT4 and high fT3/fT4. Thyroid hormones are important determinants of glucose homeostasis. Relevant studies have shown that hypothyroidism and subclinical hypothyroidism can cause insulin resistance, and even high TSH in the normal range is positively correlated with insulin resistance [34, 35].
The relationship between thyroid function and non-alcoholic fatty liver disease (NAFLD) has received extensive attention recently [36,37,38]. It has been reported that in the euthyroid population, fT3 and TSH concentrations are positively associated with the risk of NAFLD [37], and Bril et al. found that low plasma fT4 is associated with a high prevalence of NAFLD [36]. Although we did not have access to data with which to fully assess the degree of risk of NAFLD, we recommend that physicians pay attention to thyroid function in overweight or obese people to prevent the adverse effects of dysregulation of the HPT on metabolism and the liver.
The present study had a number of strengths and weaknesses. We studied a large dataset, in which all the participants had undergone standardized anthropometric and biochemical measurements, thereby minimizing the effects of measurement error. However, we are unable to infer causality, because this was a retrospective cross-sectional study. Furthermore, we were unable to account for a number of confounding factors, including smoking, alcohol, diet, and physical activity, information regarding which was not recorded at the health checks.
Conclusions
Compared with normal weight individuals, overweight individuals are more likely to have high serum concentrations of fT3 and low concentrations of fT4; obese individuals are more likely to have high concentrations of TSH and fT3/fT4; and underweight individuals are more likely to have high concentrations of fT4 and low concentrations of fT3. Relationships between thyroid parameters and metabolic risk factors were also observed, which suggest that thyroid function is one factor that influences body weight and the development of co-morbidities of obesity. Further longitudinal studies are required to determine whether these are causal relationships, and more research is needed to determine whether interventions should be recommended to reduce the unfavorable effects of HPT axis dysregulation in obesity.
Availability of data and materials
The data that support the findings of this study are available on request from the corresponding author Yongman Lv. The data have not been made publicly available because they contain information that could compromise the privacy or consent of the study participants.
Abbreviations
- BMI:
-
Body mass index
- BP:
-
Blood pressure
- FBG:
-
Fasting blood glucose
- fT3:
-
free triiodothyronine
- fT3/ fT4:
-
free triiodothyronine/free thyroxine ratio
- fT4:
-
free thyroxine
- HbA1c:
-
Hemoglobin A1
- HDL-C:
-
High-density lipoprotein cholesterol
- HPT axis:
-
Hypothalamic-pituitary-thyroid axis
- LDL-C:
-
Low-density lipoprotein cholesterol
- NAFLD:
-
Non-alcoholic fatty liver disease
- TC:
-
Total cholesterol
- TG:
-
Triglyceride
- TRH:
-
Thyrotropin-releasing hormone
- TSH:
-
Thyroid stimulating hormone
References
Danforth E Jr, Burger A. The role of thyroid hormones in the control of energy expenditure. Clin Endocrinol Metab. 1984;13:581–95.
al-Adsani H, Hoffer LJ, Silva JE. Resting energy expenditure is sensitive to small dose changes in patients on chronic thyroid hormone replacement. J Clin Endocrinol Metab. 1997;82:1118–25.
Villabona C, Sahun M, Roca M, Mora J, Gomez N, Gomez JM, Puchal R, Soler J. Blood volumes and renal function in overt and subclinical primary hypothyroidism. Am J Med Sci. 1999;318:277–80.
Michalaki MA, Vagenakis AG, Leonardou AS, Argentou MN, Habeos IG, Makri MG, Psyrogiannis AI, Kalfarentzos FE, Kyriazopoulou VE. Thyroid function in humans with morbid obesity. Thyroid. 2006;16:73–8.
Salerno M, Capalbo D, Cerbone M, De Luca F. Subclinical hypothyroidism in childhood - current knowledge and open issues. Nat Rev Endocrinol. 2016;12:734–46.
Jin HY. Prevalence of subclinical hypothyroidism in obese children or adolescents and association between thyroid hormone and the components of metabolic syndrome. J Paediatr Child Health. 2018;54:975–80.
Kok P, Roelfsema F, Langendonk JG, Frolich M, Burggraaf J, Meinders AE, Pijl H. High circulating thyrotropin levels in obese women are reduced after body weight loss induced by caloric restriction. J Clin Endocrinol Metab. 2005;90:4659–63.
De Pergola G, Ciampolillo A, Paolotti S, Trerotoli P, Giorgino R. Free triiodothyronine and thyroid stimulating hormone are directly associated with waist circumference, independently of insulin resistance, metabolic parameters and blood pressure in overweight and obese women. Clin Endocrinol. 2007;67:265–9.
Biondi B. Thyroid and obesity: an intriguing relationship. J Clin Endocrinol Metab. 2010;95:3614–7.
Muscogiuri G, Sorice GP, Mezza T, Prioletta A, Lassandro AP, Pirronti T, Della Casa S, Pontecorvi A, Giaccari A. High-normal TSH values in obesity: is it insulin resistance or adipose tissue's guilt? Obesity (Silver Spring). 2013;21:101–6.
Soriguer F, Valdes S, Morcillo S, Esteva I, Almaraz MC, de Adana MS, Tapia MJ, Dominguez M, Gutierrez-Repiso C, Rubio-Martin E, et al. Thyroid hormone levels predict the change in body weight: a prospective study. Eur J Clin Investig. 2011;41:1202–9.
Marzullo P, Minocci A, Tagliaferri MA, Guzzaloni G, Di Blasio A, De Medici C, Aimaretti G, Liuzzi A. Investigations of thyroid hormones and antibodies in obesity: leptin levels are associated with thyroid autoimmunity independent of bioanthropometric, hormonal, and weight-related determinants. J Clin Endocrinol Metab. 2010;95:3965–72.
Lundback V, Ekbom K, Hagman E, Dahlman I, Marcus C. Thyroid-stimulating hormone, degree of obesity, and metabolic risk markers in a cohort of Swedish children with obesity. Horm Res Paediatr. 2017;88:140–6.
Wolffenbuttel BHR, Wouters H, Slagter SN, van Waateringe RP, Muller Kobold AC, van Vliet-Ostaptchouk JV, Links TP, van der Klauw MM. Thyroid function and metabolic syndrome in the population-based LifeLines cohort study. BMC Endocr Disord. 2017;17:65.
Ferrannini E, Iervasi G, Cobb J, Ndreu R, Nannipieri M. Insulin resistance and normal thyroid hormone levels: prospective study and metabolomic analysis. Am J Physiol Endocrinol Metab. 2017;312:E429–e36.
Rahbar AR, Kalantarhormozi M, Izadi F, Arkia E, Rashidi M, Pourbehi F, Daneshifard F, Rahbar A. Relationship between body mass index, waist-to-hip ratio, and serum lipid concentrations and thyroid-stimulating hormone in the Euthyroid adult population. Iran J Med Sci. 2017;42:301–5.
Guidelines for the prevention and control of overweight and obesity in Chinese adults (excerpt). Chinese working group on obesity. J Nutr. 2004;01:1–4.
Chinese guidelines on prevention and treatment of dyslipidemia in adultsJoint committee for developing Chinese guidelines on prevention and treatment of dyslipidemia in adults. Chinese J Cardiol. 2016;44:833–53.
Kim B. Thyroid hormone as a determinant of energy expenditure and the basal metabolic rate. Thyroid. 2008;18:141–4.
Weiss RE, Brown RL. Doctor . . . Could it be my thyroid? Arch Intern Med. 2008;168:568–9.
Reinehr T, Isa A, de Sousa G, Dieffenbach R, Andler W. Thyroid hormones and their relation to weight status. Horm Res. 2008;70:51–7.
Reinehr T, de Sousa G, Andler W. Hyperthyrotropinemia in obese children is reversible after weight loss and is not related to lipids. J Clin Endocrinol Metab. 2006;91:3088–91.
Grandone A, Santoro N, Coppola F, Calabro P, Perrone L, Del Giudice EM. Thyroid function derangement and childhood obesity: an Italian experience. BMC Endocr Disord. 2010;10:8.
Iacobellis G, Ribaudo MC, Zappaterreno A, Iannucci CV, Leonetti F. Relationship of thyroid function with body mass index, leptin, insulin sensitivity and adiponectin in euthyroid obese women. Clin Endocrinol. 2005;62:487–91.
Duarte GC, Cendoroglo MS, Araujo LM, Almada Filho Cde M. Association between increased serum thyrotropin concentration and the oldest old: what do we know? Einstein (Sao Paulo). 2015;13:117–21.
Harvey J. Leptin: a diverse regulator of neuronal function. J Neurochem. 2007;100:307–13.
Duntas LH, Biondi B. The interconnections between obesity, thyroid function, and autoimmunity: the multifold role of leptin. Thyroid. 2013;23:646–53.
Bell A, Gagnon A, Sorisky A. TSH stimulates IL-6 secretion from adipocytes in culture. Arterioscler Thromb Vasc Biol. 2003;23:e65–6.
Ishii H, Inada M, Tanaka K, Mashio Y, Naito K, Nishikawa M, Matsuzuka F, Kuma K, Imura H. Induction of outer and inner ring monodeiodinases in human thyroid gland by thyrotropin. J Clin Endocrinol Metab. 1983;57:500–5.
Beech SG, Walker SW, Arthur JR, Lee D, Beckett GJ. Differential control of type-I iodothyronine deiodinase expression by the activation of the cyclic AMP and phosphoinositol signalling pathways in cultured human thyrocytes. J Mol Endocrinol. 1995;14:171–7.
Karavani G, Strich D, Edri S, Gillis D. Increases in thyrotropin within the near-normal range are associated with increased triiodothyronine but not increased thyroxine in the pediatric age group. J Clin Endocrinol Metab. 2014;99:E1471–5.
Rizos CV, Elisaf MS, Liberopoulos EN. Effects of thyroid dysfunction on lipid profile. Open Cardiovasc Med J. 2011;5:76–84.
Roos A, Bakker SJ, Links TP, Gans RO, Wolffenbuttel BH. Thyroid function is associated with components of the metabolic syndrome in euthyroid subjects. J Clin Endocrinol Metab. 2007;92:491–6.
Baeza I, Vigo L, La Serna ED, Calvoescalona R, Merchannaranjo J, Rodriguezlatorre P, Arango C, Castrofornieles J. The effects of antipsychotics on weight gain, weight-related hormones and homocysteine in children and adolescents: a 1-year follow-up study. European Child Adolesc Psychiatry. 2017;26:35–46.
Wanjia X, Chenggang W, Aihong W, Xiaomei Y, Jiajun Z, Chunxiao Y, Jin X, Yinglong H, Ling G. A high normal TSH level is associated with an atherogenic lipid profile in euthyroid non-smokers with newly diagnosed asymptomatic coronary heart disease. Lipids Health Dis. 2012;11:44.
Bril F, Kadiyala S, Portillo Sanchez P, Sunny NE, Biernacki D, Maximos M, Kalavalapalli S, Lomonaco R, Suman A, Cusi K. Plasma thyroid hormone concentration is associated with hepatic triglyceride content in patients with type 2 diabetes. J Investig Med. 2016;64:63–8.
Liu Y, Wang W, Yu X, Qi X. Thyroid function and risk of non-alcoholic fatty liver disease in Euthyroid subjects. Ann Hepatol. 2018;17:779–88.
Tao Y, Gu H, Wu J, Sui J. Thyroid function is associated with non-alcoholic fatty liver disease in euthyroid subjects. Endocr Res. 2015;40:74–8.
Acknowledgements
We thank all the participants and staff of the Physical Examination Center of Tongji Hospital for their contribution to this study. We also thank Mark Cleasby, PhD for editing the English text of a draft of this manuscript.
Funding
There were no sources of funding for this study.
Author information
Authors and Affiliations
Contributions
RX designed and conceived the study and drafted the manuscript. YL participated in the study design and data collection. FH and SZ performed the statistical analysis. QL critically revised the manuscript. All authors read and approved the final manuscript.
Corresponding authors
Ethics declarations
Ethics approval and consent to participate
The study protocol was approved by the Ethics Committee of Tongji Hospital, Tongji Medical College, Huazhong University of Science and Technology. All participants provided written informed consent before participating in the study.
Consent for publication
Not applicable.
Competing interests
The authors declare that they have no competing interests.
Additional information
Publisher’s Note
Springer Nature remains neutral with regard to jurisdictional claims in published maps and institutional affiliations.
Rights and permissions
Open Access This article is distributed under the terms of the Creative Commons Attribution 4.0 International License (http://creativecommons.org/licenses/by/4.0/), which permits unrestricted use, distribution, and reproduction in any medium, provided you give appropriate credit to the original author(s) and the source, provide a link to the Creative Commons license, and indicate if changes were made. The Creative Commons Public Domain Dedication waiver (http://creativecommons.org/publicdomain/zero/1.0/) applies to the data made available in this article, unless otherwise stated.
About this article

Cite this article
Xu, R., Huang, F., Zhang, S. et al. Thyroid function, body mass index, and metabolic risk markers in euthyroid adults: a cohort study. BMC Endocr Disord 19, 58 (2019). https://doi.org/10.1186/s12902-019-0383-2
Received:
Accepted:
Published:
DOI: https://doi.org/10.1186/s12902-019-0383-2